


Cricket Betting Odds Tell You More Than Who’s Favourite
Years ago, I placed a bet at odds of 2.50 because I thought the number “looked good.” I had no idea what 2.50 actually meant in probability terms, no understanding of the margin baked into it, and no concept of whether the price fairly reflected the likely outcome. I won the bet, which was the worst possible result — it reinforced a habit of treating odds as decoration rather than information. It took another 50 losing bets at prices I did not understand before I sat down and learned to read them properly.
Cricket betting odds are a language. They encode the bookmaker’s assessment of probability, filtered through a commercial margin, and shaped by the weight of money from every other punter in the market. If you cannot read that language fluently, you are making decisions in the dark. The UK’s online sports betting market generated revenue of over $11 billion in 2024 alone, and it is projected to nearly double by 2030. The operators setting these odds are not guessing — they are pricing with precision and profiting from punters who do not understand the price they are accepting.
Cricket remains a niche within the broader UK sports betting market — by industry estimates, only around 7% of the country’s sports bettors wager on cricket regularly, according to YouGov survey data. That smaller scale actually works in the bettor’s favour in one important respect: cricket odds are less efficiently priced than football odds. The bookmaker deploys fewer resources to cricket markets, the volume of money shaping the price is lower, and the opportunities for a knowledgeable punter to disagree with the market and be right are correspondingly greater. But exploiting those opportunities requires understanding what the odds are telling you — and what they are hiding.
This article breaks down that language step by step: format by format, concept by concept, with the numbers laid out in full. By the end, you will read a cricket betting price and immediately know the implied probability, the bookmaker’s cut, and whether the price represents genuine value or an expensive trap.
Decimal, Fractional, and American: Three Ways to See the Same Price
When I first started comparing prices across bookmakers, I was baffled by the fact that the same bet appeared as 2.50 on one site, 6/4 on another, and +150 on a third. It felt like three different bets. It is not. These are three notations for exactly the same price, and understanding all three is essential because different operators default to different formats, and switching fluently between them lets you compare prices without reaching for a calculator.
Decimal odds are the simplest. The number tells you the total return per pound staked, including your original stake. If you bet £10 at 2.50, your total return is £25 — that is £10 back plus £15 profit. I use decimal odds as my default because the arithmetic is straightforward: profit equals stake multiplied by odds minus stake. Decimal odds are also the easiest format for comparing prices across a field of runners. A glance at 3.20, 3.40, and 3.60 tells you immediately which price is the longest without any mental conversion.
Fractional odds are the traditional UK format, and you will encounter them frequently in cricket markets, particularly on older platforms and in broadcast graphics. The fraction represents profit relative to stake. Odds of 6/4 mean that for every £4 staked, you receive £6 in profit — plus your £4 back, for a total return of £10. To convert fractional to decimal, divide the numerator by the denominator and add one: 6 divided by 4 is 1.5, plus 1 gives 2.50. Same price, different label. The quirk of fractional odds is that unfamiliar fractions — 11/8, 5/6, 4/7 — require mental effort to parse quickly, which is why I prefer decimal for analytical work and switch to fractional only when a bookmaker’s interface demands it.
American odds, also called moneyline odds, are built around a baseline of 100. A positive number tells you how much profit you make on a £100 stake: +150 means £150 profit from £100 wagered. A negative number tells you how much you need to stake to win £100: -200 means you must stake £200 to win £100 profit. American odds are rare in UK cricket markets but appear on some international platforms and are worth understanding if you shop for prices globally. To convert: for positive American odds, divide by 100 and add 1 to get decimal (so +150 becomes 2.50). For negative American odds, divide 100 by the absolute value and add 1 (so -200 becomes 1.50).
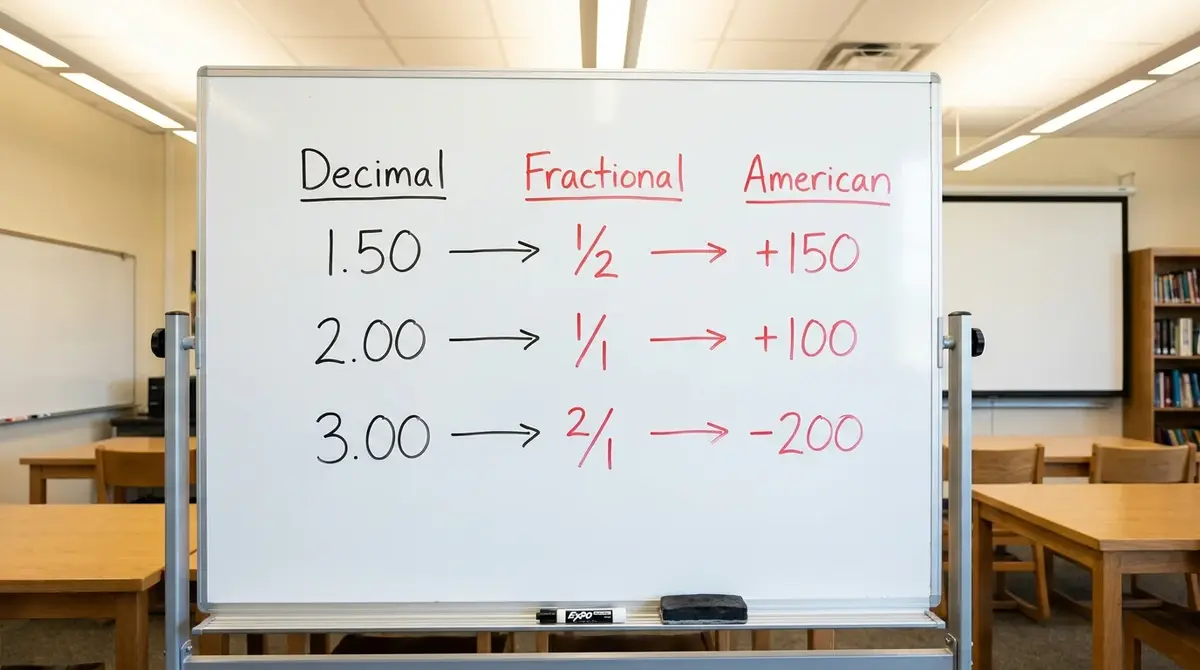
Regardless of format, the critical skill is recognising that odds are not just a number — they are a probability estimate wrapped in a commercial layer. The bookmaker does not set odds at 2.50 because they think the outcome has a 40% chance of happening. They set odds at 2.50 because, after building in their margin, that is the price that balances their book. The next section unpacks exactly how to strip away that margin and see the raw probability underneath.
Implied Probability: Turning Odds into Percentages
A number changed my betting overnight: 1 divided by the decimal odds, multiplied by 100. That formula converts any decimal price into an implied probability percentage, and once I started applying it to every bet, I stopped seeing odds as abstract numbers and started seeing them as the bookmaker’s opinion about how likely something is to happen.
Take a concrete example. England are 1.80 to win a T20 against South Africa. The implied probability is 1 divided by 1.80, which gives 0.5556, or 55.6%. South Africa are 2.10, which converts to 47.6%. Add those two percentages together and you get 103.2%. In a fair market, the probabilities would sum to exactly 100%. The extra 3.2% is the bookmaker’s margin — the overround — which I will cover in detail shortly. For now, the point is that the true implied probabilities are slightly lower than the raw numbers suggest. Adjusting for the overround, England’s “real” implied probability is closer to 53.8% and South Africa’s is closer to 46.2%.
Why does this matter? Because it transforms betting from a guessing game into a comparison exercise. Instead of asking “Will England win?” — a question with no measurable answer — you ask “Is England’s probability of winning greater than 53.8%?” That question can be answered with data: recent form in the format, head-to-head record in similar conditions, squad strength, pitch analysis, and all the other inputs from your pre-match research. If your assessment lands at 60%, you have a value bet. If it lands at 50%, you do not — no matter how confident you feel about England winning.
I convert implied probabilities for every bet I place, without exception. It takes five seconds on a phone calculator and it prevents the single most common error in recreational betting: backing a favourite at short odds without realising that the price implies a probability so high that even a strong team cannot realistically justify it. A team priced at 1.25 carries an implied probability of 80%. Ask yourself honestly: in cricket, how often does any team win 80% of the time in a given format against quality opposition? In T20, the answer is almost never. Even dominant sides win roughly 65% to 70% of their matches across a season. A price of 1.25 is nearly always too short, and without the implied probability calculation, you would never know.
The formula works in reverse too. If you believe a team has a 40% chance of winning, the fair decimal odds would be 1 divided by 0.40, which is 2.50. If the bookmaker is offering 3.00, the price is longer than your estimate — that is a potential value bet. If they are offering 2.20, it is too short. This two-way conversion is the foundation of every pricing decision I make.
Why Cricket Odds Move — and What It Signals
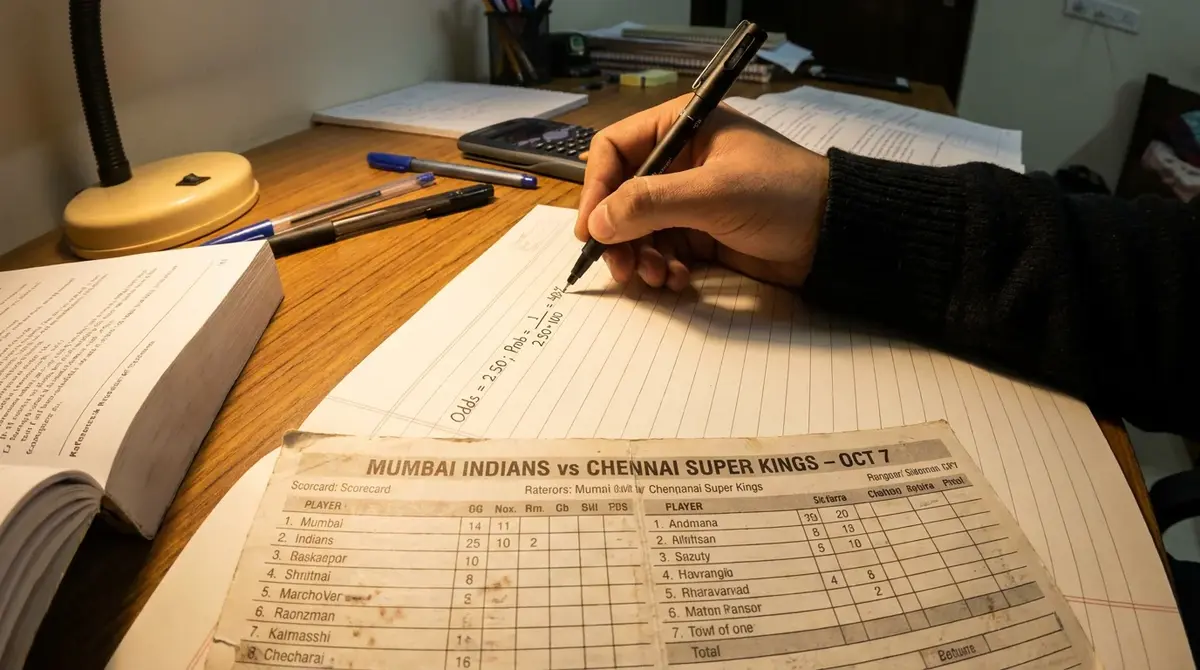
I once watched the odds on a match-winner market shift from 1.95 to 1.72 in the space of 40 minutes, with no news, no team announcement, and no change in weather. At the time, I assumed it was random. It was not. Odds move because money moves, and money moves because somebody — or a collection of somebodies — has decided to act. Understanding why prices shift before a ball is bowled is one of the most valuable skills a cricket bettor can develop.
The most common cause of pre-match movement is team news. When a key player is confirmed in or out of the starting XI, the bookmaker adjusts the price to reflect the change in team strength. In cricket, this effect is amplified because individual players contribute a disproportionate share of a team’s output. Losing your lead fast bowler in a Test match is not like losing a midfielder in football — it can swing the probability by five or six percentage points. I monitor team announcements obsessively and try to be among the first to act when a price has not yet fully adjusted to a lineup change.
The second driver is market money — bets placed by other punters, particularly sharp bettors and syndicates whose wagers the bookmaker respects. When a significant sum lands on one side of a market, the bookmaker shortens that side’s odds and lengthens the other side’s to manage their liability. This movement tells you something about the weight of informed opinion in the market. It does not tell you whether that opinion is correct, but persistent movement in one direction, driven by smart money, is a signal worth respecting.

The third driver is cross-market arbitrage. The two largest UK operators account for more than half of all search advertising clicks in the sports betting space, but the market includes dozens of smaller operators, and prices across them are not always aligned. When a discrepancy appears, sharp bettors exploit it, which forces the operators to converge their prices. As a bettor, you can benefit from these brief windows of misalignment by holding accounts across multiple platforms and checking prices before committing.
The signal I watch most closely is what I call “late steam” — a sharp, sudden price movement in the final 30 minutes before the toss. This pattern typically indicates that information has entered the market which is not yet public: a player passing or failing a fitness test, a late squad change, or pitch conditions that differ from the forecast. I do not blindly follow late steam, but I treat it as a flag to pause and reassess my position. If the steam aligns with my pre-match analysis, it reinforces the bet. If it contradicts my analysis, I either reduce my stake or stand down entirely. Odds are not just numbers on a screen — they are a conversation, and learning to listen to that conversation gives you an edge that pure statistical analysis cannot.
The Overround: How Bookmakers Build Their Margin
I remember explaining the overround to a friend who had been betting for years. His reaction was: “So I’m paying a fee on every bet?” Yes. That is exactly what the overround is — a built-in fee that ensures the bookmaker profits regardless of the outcome. And understanding its size, structure, and variation across markets is the difference between informed betting and expensive ignorance.
The overround is the amount by which the sum of all implied probabilities in a market exceeds 100%. In the England versus South Africa example from the previous section, the implied probabilities totalled 103.2%, making the overround 3.2%. That means for every £100 wagered across the market, the bookmaker expects to retain roughly £3.10 — assuming balanced action on both sides. The remote betting sector in the UK generated £2.4 billion in gross gambling yield in a single reporting year. A meaningful share of that income comes directly from the overround built into every price on every market.
Cricket overrounds vary significantly by market type. Match-winner markets on high-profile T20 matches typically carry overrounds of 3% to 5%, because competition among bookmakers forces tight pricing. Niche markets — top bowler in a Bangladesh Premier League fixture, for instance — can carry overrounds of 8% to 12%, because fewer operators price them and fewer punters bet on them. The higher the overround, the larger the edge you need just to break even. I avoid any market with an overround above 8% unless my analysis identifies a substantial mispricing that more than compensates for the cost.

Calculating the overround is simple. Convert each price in a market to an implied probability, add them together, and subtract 100. The result is the percentage the bookmaker is taking. I do this calculation for every market I enter, and it has steered me away from hundreds of bets that looked attractive on the surface but were priced with a punitive margin underneath.
Andy Boucher, chairing GambleAware’s board of trustees, framed the organisation’s mission in direct terms: their priority was “keeping people safe from gambling harm.” Understanding the overround is part of that safety. It ensures you know the cost of participation before you participate. A bettor who does not know the overround is like a shopper who does not check the price tag — they will spend more than they intended, and they will not know why.
Comparing Odds Across Bookmakers
The single easiest way to improve your long-term cricket betting results requires no analytical skill whatsoever. It is this: check the price at more than one bookmaker before placing your bet. I spent three years betting exclusively with one operator because I liked their interface. When I finally opened accounts elsewhere and started comparing, I discovered I had been accepting prices that were 3% to 5% worse than the best available on the same markets. Over hundreds of bets, that difference compounds into a substantial drag on returns.
Odds comparison is not complicated. For any given market, different operators will offer slightly different prices. One might have England at 1.83 while another has them at 1.90. On a £50 stake, the difference in profit is £3.50 — trivial on a single bet but significant over a year of betting. If you place 200 bets a year and capture an average of £3 per bet by shopping for the best price, that is £600 in additional profit from a process that takes 30 seconds per bet.
The reasons prices vary are structural. Bookmakers have different liability profiles, different customer bases, and different risk appetites. An operator with heavy exposure on one side of a market will shorten those odds to discourage further action, while a competitor with balanced exposure on the same market has no need to adjust. These divergences create pockets of value that a single-account bettor will never see.
Cricket markets tend to show wider price discrepancies than football markets for a straightforward reason: fewer bettors means less liquidity, which means less pressure on operators to converge their prices. I have seen the same match-winner outcome priced at 2.80 on one platform and 3.20 on another — a gap that would be unthinkable in a Premier League match but is routine in a Test series between mid-ranked nations. Holding accounts with three to five UKGC-licensed operators is, in my view, a prerequisite for serious cricket betting.
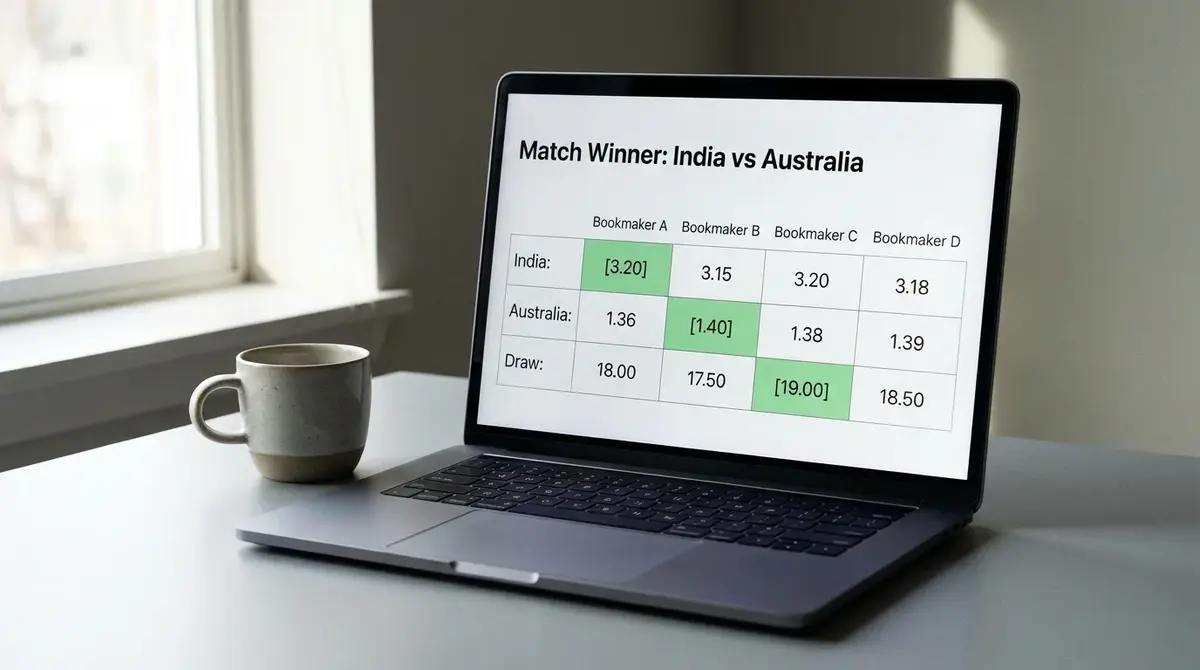
One caveat: comparing odds only works if you actually act on the comparison. I have met punters who check three platforms, identify the best price, and then place the bet on their “favourite” platform out of habit or loyalty. That defeats the purpose entirely. The operator with the best price on this bet will not be the same operator with the best price on the next bet. Loyalty to a single bookmaker is a luxury the profitable bettor cannot afford.
Odds comparison sites and aggregator tools exist to speed up this process, and I use them as a starting point. But I always verify the displayed price directly on the bookmaker’s platform before clicking, because aggregator feeds can lag by several minutes — enough time for a price to move, particularly close to match start.
How Odds Stack in Accumulators and Multi-Bets
Accumulators are the most misunderstood product in cricket betting, and the misunderstanding starts with how odds combine. When you add a second selection to a bet slip, the bookmaker multiplies the decimal odds of each leg together to produce the combined price. Two selections at 2.00 each give you 4.00. Three selections at 2.00 each give you 8.00. The numbers climb fast, which is exactly why accumulators are seductive — the potential payout from a small stake is enormous. But the mathematics running underneath that seduction are working against you with every leg you add.
Here is the problem. Each leg carries its own overround, and those overrounds compound. If a single-bet market has a 4% overround, a two-leg accumulator effectively carries an 8% overround, a three-leg carries 12%, and so on. By the time you reach a five-fold accumulator, the bookmaker’s cumulative margin can exceed 20%. You are not just betting against the odds on each selection — you are betting against a stacking fee that grows with every leg. I stopped placing accumulators above three legs after my records showed they were the single biggest drain on my bankroll.
That does not mean accumulators are always a bad idea. A two-leg accumulator on strongly correlated outcomes — say, the same team to win and the same player to be top scorer — can represent fair value if the bookmaker’s model treats the two outcomes as independent when they are not. The key is understanding that the combined odds are not a bonus; they are a product of individual prices, each of which contains a margin, and the aggregate margin is your true cost. For a deeper look at how to build smarter multi-bet selections, I have covered the tactical side in a separate guide on cricket accumulator tips.
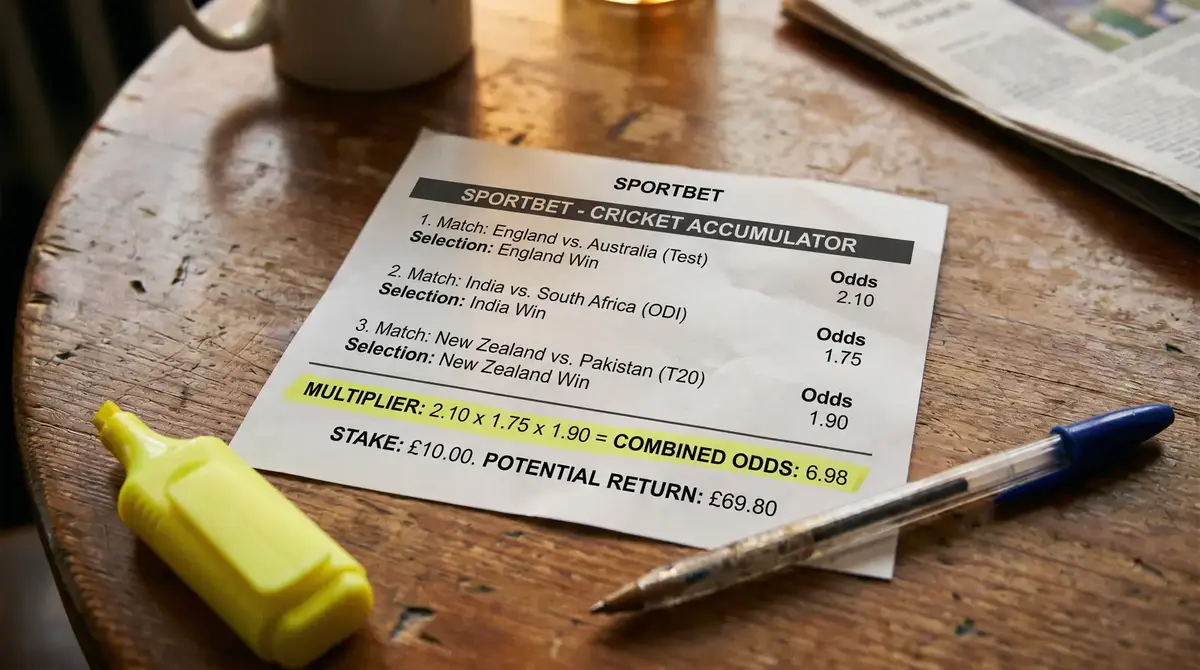
The practical takeaway: before placing any accumulator, convert each leg’s odds to implied probability, multiply those probabilities together to get the combined probability, then compare it to your own estimate of the combined probability. If the bookmaker’s combined price implies a lower probability than your estimate, the accumulator has value. If it implies a higher probability, you are paying too much — and in my experience, the latter is the case far more often than the former.
Cricket Betting Odds — Common Questions
Articles
Written by the editors at cricketbettipsonline.com.
