

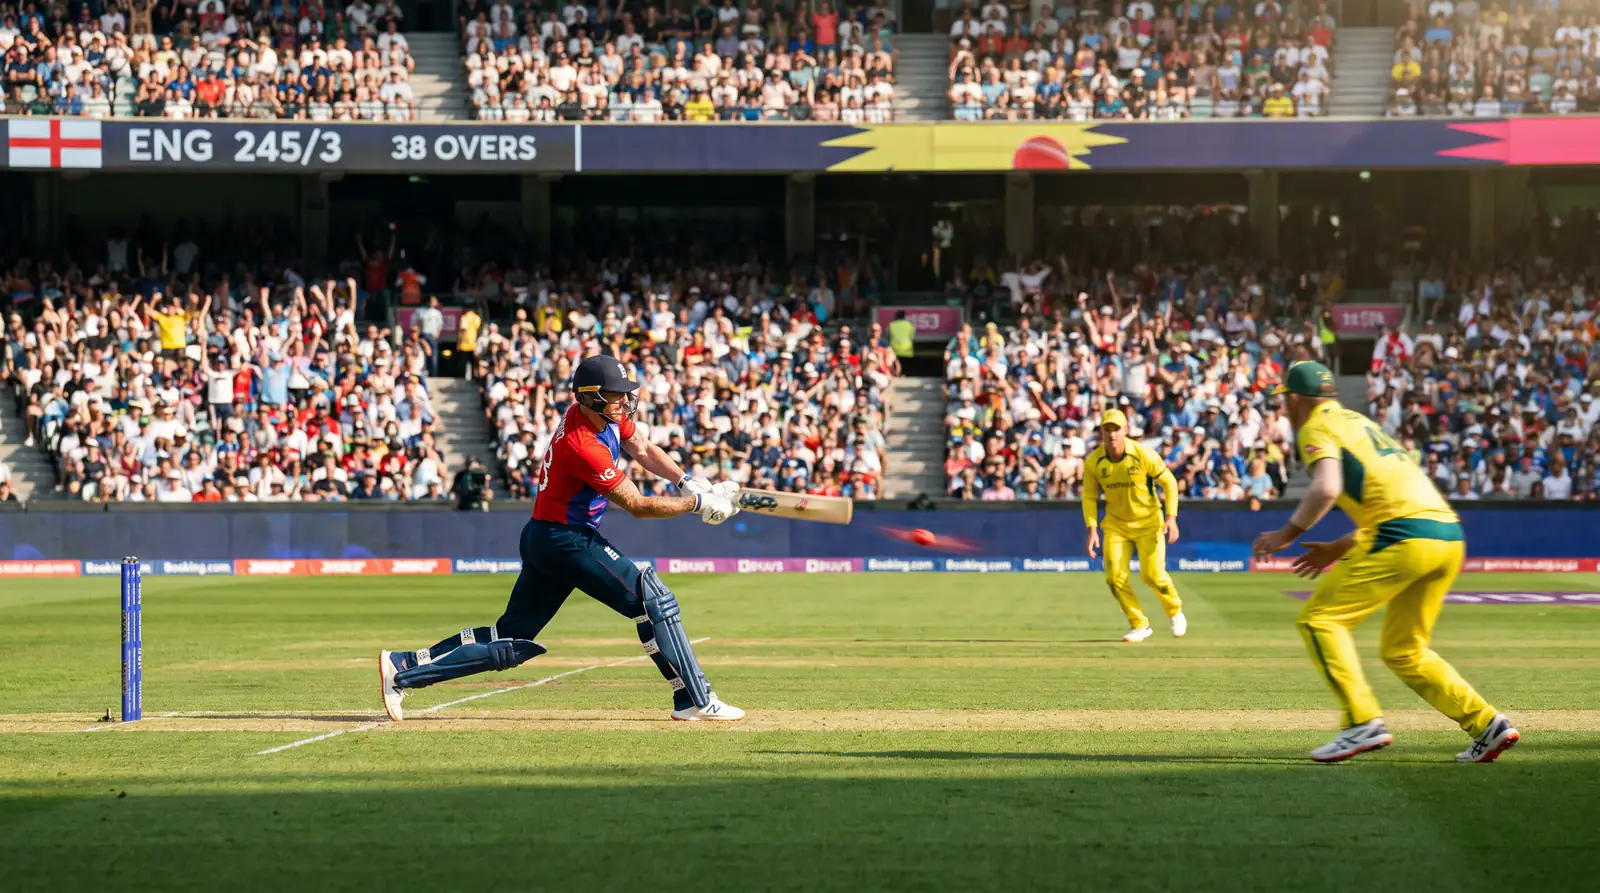
ODI Cricket Betting Tips Thrive in the Format Most Punters Overlook
Everyone talks about T20 betting. The pace is intoxicating, the markets are liquid, and the turnaround is fast. But my highest ROI across nine years of cricket betting has consistently come from ODIs — not because the format is better, but because fewer sharp bettors focus on it. The attention gap creates pricing inefficiencies that a disciplined punter can exploit match after match.
The 50-over format sits in a sweet spot for betting analysis. It’s long enough for quality differences between teams to emerge — unlike T20, where a single over can invert the match — yet short enough to avoid the draw complication that muddles Test match outcomes. UK bettors place approximately 290 million online bets per month on real sporting events, and the share directed at ODI cricket is disproportionately low relative to the analytical opportunities the format offers. This mismatch between market attention and market value is exactly where I concentrate my staking.
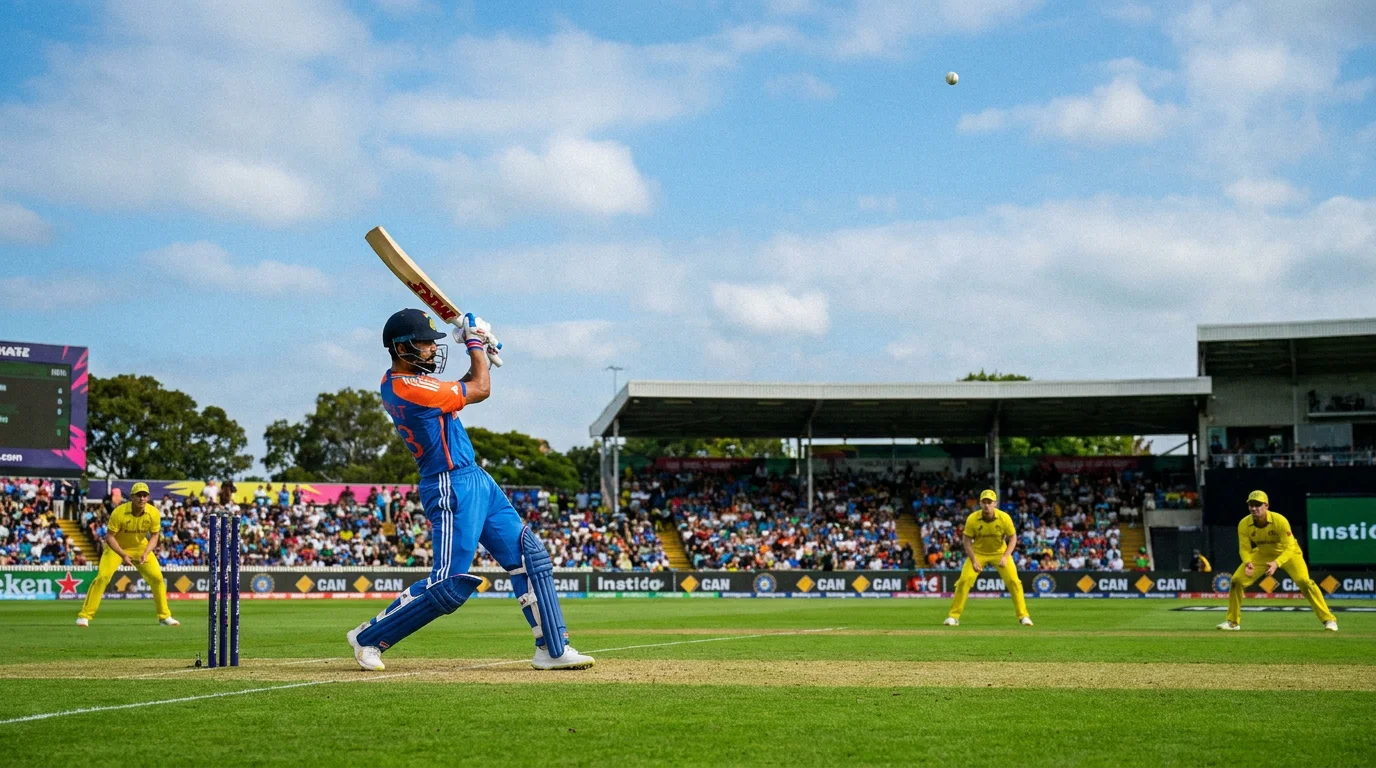
ODI cricket also generates the clearest in-play betting signals of any format. The innings break provides a natural reset point where you can reassess the match with a concrete first-innings total, pitch behaviour data from 50 overs, and a clear target for the chasing side. T20 offers no such clarity — the reset happens too quickly. Tests offer too many variables across five days. The ODI innings break is the single best moment in cricket betting to identify value.
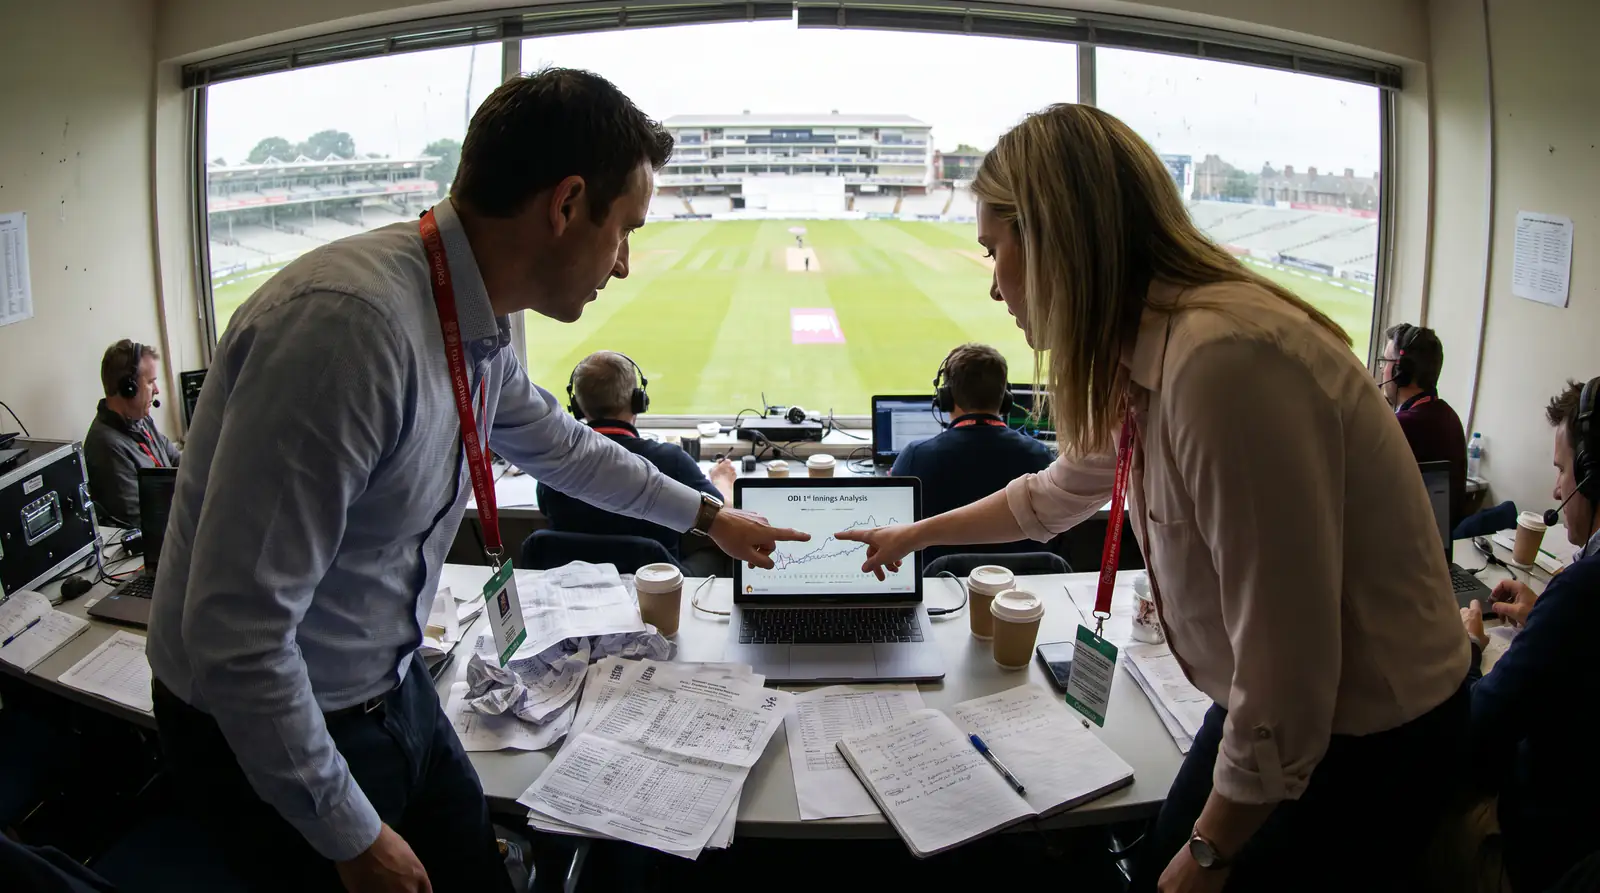
How ODI Scoring Dynamics Shape the Betting Market
Fifty-over innings have three distinct phases, and each phase creates different betting opportunities.
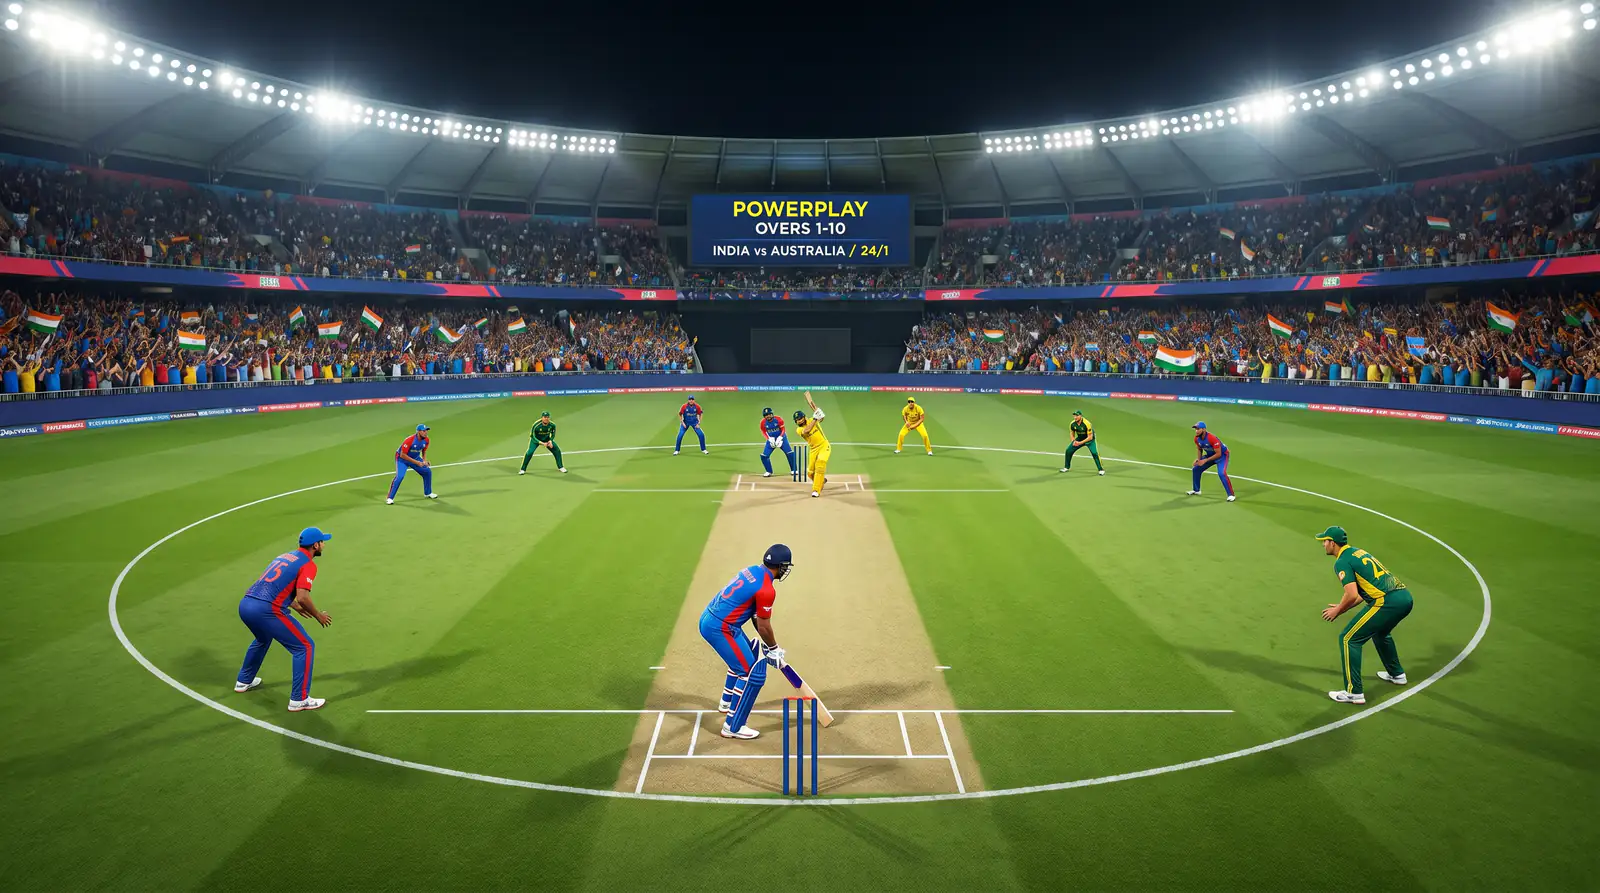
The powerplay (overs 1-10) sets the platform. Field restrictions force the bowling side to concede boundaries, which means powerplay scoring is high but volatile. A team that reaches 65/0 after 10 overs looks dominant — but that identical score with two wickets down (65/2) tells a different story. I pay less attention to the powerplay run rate and more attention to the wicket count, because wickets in the powerplay compress the middle-overs scoring rate more than run flow in the powerplay inflates the final total.
The middle overs (11-40) are where matches are won and lost. This 30-over phase produces the bulk of the innings total, and the run rate during these overs is the most stable predictor of the final score. A team maintaining 5.5 per over through the middle overs with six wickets in hand is tracking toward 280-300. The same rate with only four wickets in hand projects to 250-260, because the lower order can’t sustain the same tempo. Projecting the final total accurately during the middle overs — not after the innings ends — is the skill that generates live betting edges.
The death overs (41-50) are where variance spikes. A team with wickets in hand can add 80-100 runs in this phase. A team that’s eight or nine down might add only 30-40. The market tends to project death-overs scoring based on the overall match state rather than the specific batsmen at the crease, which creates opportunities when a recognised hitter arrives late in the innings. If a destructive lower-order batsman comes in at number 7 with 8 overs remaining, the total projection should jump — but the live total line often lags behind by 10-15 runs.

Chasing vs Setting: The Structural Advantage in ODIs
I tracked 400 ODI matches across three years to answer one question: does batting first or second carry a genuine structural advantage? The answer is less straightforward than in T20, where chasing wins 53-55% of the time.
In ODIs, the chasing team wins approximately 51-53% of matches overall — a modest advantage that’s smaller than in T20 because the longer format provides more time for the bowling side to build pressure. However, this average masks enormous venue-specific variation. At grounds where dew is a factor — most subcontinental venues during day-night matches — the chasing advantage rises to 58-62%. At English grounds with consistent conditions throughout the day, the chasing advantage drops to 49-51%, making it essentially neutral.
The betting application is venue-specific research. Before an ODI, I check the last 10-15 matches at that ground and calculate the win percentage for teams batting first versus second. If the venue shows a clear historical pattern, I adjust my pre-match probability accordingly. A team I’d rate at 50% in a neutral scenario might become 53% if they’re batting second at a venue with a 60% chasing win rate — and that 3% adjustment, applied consistently across a season, compounds into meaningful profit.

Nick Rust, former head of the British Horseracing Authority and chair of the UKGC Industry Forum, has talked about the need for regulators to “better understand the implications of its existing and planned policies for consumers and industry operators.” One area where that understanding matters is how ODI betting markets — particularly live odds during the innings break — are structured and priced across different platforms. The regulatory framework shapes how operators set odds, and operators who invest more in their ODI pricing models create tighter markets that offer fewer edges. Choosing where you bet on ODIs matters as much as choosing what you bet on.
Live Betting During the Innings Break: The ODI Edge
The innings break in an ODI is a 15-minute window where I make more analytical decisions than at any other point in a cricket match.
By the time the first innings ends, you have hard data: the exact total, the pitch’s behaviour across 50 overs, the effectiveness of each bowling type, and the scoring rate at each phase. This data lets you make a far more accurate second-innings projection than any pre-match model could produce. The market adjusts during the break, but it adjusts imperfectly — and those imperfections are your opportunity.
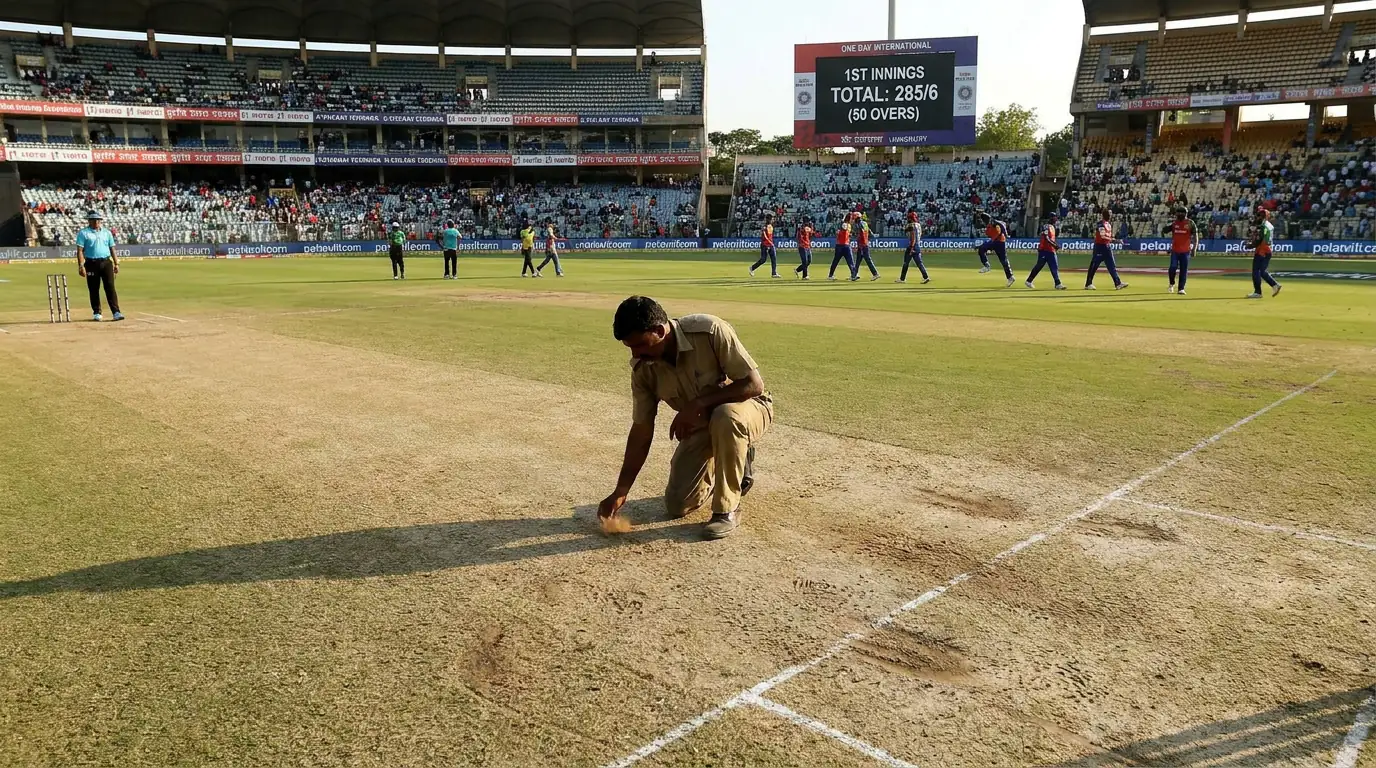
The most common market error at the innings break is undervaluing above-par totals on deteriorating pitches. If Team A scores 280 on a pitch that was true for the first 30 overs but showed cracks in the last 20, the chasing side will face an even more difficult surface. A total that looks chaseable on paper becomes significantly harder when you factor in pitch deterioration. The market prices the innings-break odds based primarily on the total, with insufficient adjustment for how the pitch will play in overs 30-50 of the second innings.
Conversely, the market overvalues totals that were inflated by one explosive partnership. If Team A posts 310 but 120 of those runs came from one 15-over stand by two in-form batsmen, the pitch itself might still be good for bowling. The total looks imposing, but the underlying conditions don’t support the number. In these cases, the chasing side’s odds are often too long, creating value on the second-innings side.
World Cup ODI matches amplify these innings-break dynamics because the stakes are higher, more money flows into the market, and the emotional pressure on the chasing side adds a psychological variable that pure data can’t fully capture. Knockout-stage chases produce more collapses than group-stage chases, which means above-par totals carry even more weight in tournament contexts.
Building a Pre-Match ODI Model: Key Inputs
The global cricket betting market reached $14.45 billion in 2024, and within that market, ODIs attract a smaller but analytically rich segment. My pre-match ODI model uses four primary inputs, weighted to reflect what actually predicts match outcomes in 50-over cricket.
Recent ODI form — the last 8-10 completed matches per team — receives the highest weighting at 35%. ODI form is format-specific and shouldn’t be blended with T20 or Test results. A team that’s dominating T20 cricket but struggling in ODIs is often overpriced in the ODI market because casual bettors don’t separate formats cleanly. I check ODI-specific win-loss records, average first-innings scores, and chase success rates independently from other formats.
Venue data receives 25% weighting. The average first-innings score, the historical chasing win rate, and the pitch behaviour patterns at the specific ground are more predictive than team rankings or head-to-head records. A venue where first-innings scores average 240 and the chasing side wins 55% of the time should shape your pre-match assessment more than whether the two teams last played six months ago.
Squad composition — specifically, the balance between batting depth and bowling variety — receives 25% weighting. ODIs reward all-rounders who can bat at six or seven and deliver 8-10 overs, because they provide the flexibility that 50-over cricket demands. A team with two genuine all-rounders has a structural advantage over a team with specialist batsmen and specialist bowlers, because the all-rounders extend the batting order and provide bowling options that adapt to match situations.
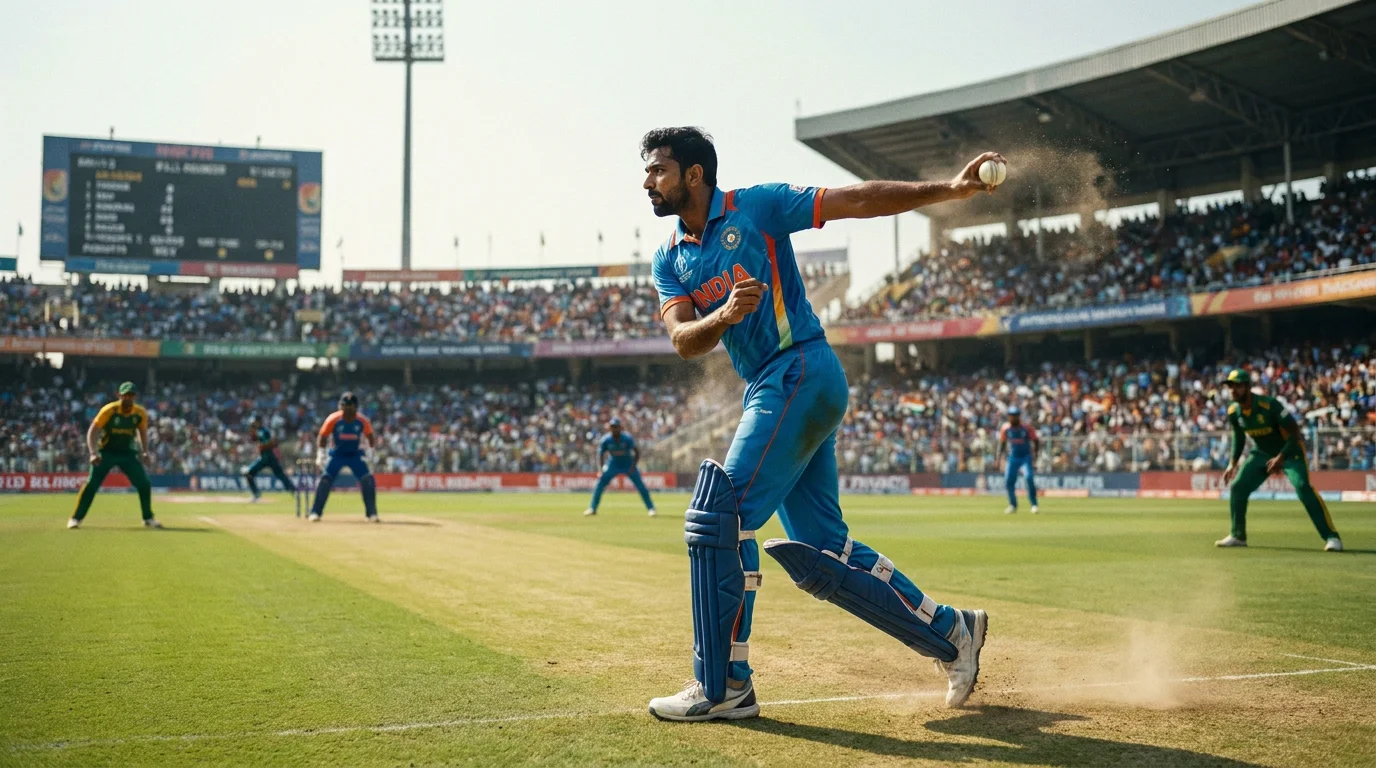
Conditions assessment — pitch, weather, toss — receives 15% weighting as a qualitative adjustment. This is the human-judgement input that separates a mechanical model from a genuinely predictive one. An unexpected green tinge on an usually flat pitch, a humidity reading that suggests more swing than normal, or a key bowler returning from injury who might be undercooked — these are the details that data alone can’t capture.
ODI Cricket Betting Tips — Questions Answered
Articles
Written by the editors at cricketbettipsonline.com.
