


T20 Betting Tips Demand Speed, Data, and a Different Mindset
My first T20 betting season was a disaster, and it was entirely my own fault. I applied the same patient, data-heavy approach that worked beautifully in Test cricket — weighing five-day pitch deterioration patterns, monitoring session-by-session scoring rates, tracking draw probabilities across multiple days — and tried to use it for a format that begins and ends in three hours. The result was paralysis. By the time I had finished my analysis, the match was already ten overs deep and my pre-match window had closed. T20 is not Test cricket played faster. It is a different sport that demands a different mindset, different metrics, and a fundamentally different approach to timing.
The numbers reinforce the point. In T20 cricket, the team batting second wins approximately 53-55% of the time, which already tells you that the format’s dynamics favour the chaser — a structural feature that barely exists in Tests. The toss influence sits at just 1.3%, far lower than the 4-5% seen in longer formats, which means pre-match analysis holds more weight relative to the coin flip. These are not marginal differences. They reshape which markets offer value, which data points matter, and how aggressively you should stake.
I have spent the past six years refining a T20-specific framework that strips out the noise unique to short-format cricket and focuses on the variables that actually predict outcomes. This guide is the result — from format traits and player metrics to league-specific adjustments and death-overs positioning. If you are betting on T20 with a one-size-fits-all cricket strategy, you are fighting with the wrong tools.
What Makes T20 Unique for Cricket Bettors
What makes T20 unique is compression. An entire match unfolds in 240 legal deliveries. Every single ball represents a measurably larger fraction of the total match than in any other format — roughly 0.4%, compared to 0.06% in a Test. That compression means individual moments carry disproportionate weight. A dropped catch in the powerplay of a T20 can swing the match outcome by three to five percentage points. The same dropped catch in the first session of a Test barely registers on the probability model. For bettors, compression translates to volatility, and volatility is where prepared punters find their edges — and where unprepared ones lose their bankrolls.
The audience profile of T20 cricket reflects this energy. Over 40% of traditional cricket fans in the UK are aged 65 or above, a demographic that gravitates towards Test cricket and its contemplative pace. T20 franchise leagues have deliberately targeted younger audiences, and The Hundred — England’s domestic 100-ball competition — has succeeded in pulling them in. Vikram Banerjee, Managing Director of The Hundred at the ECB, described the competition’s position bluntly: they are at a hugely exciting time for The Hundred, and strong crowds and viewing figures confirmed the trajectory. The tournament surpassed 2.5 million cumulative spectators across its first five seasons, with 580,000 tickets sold in 2025 alone. Across The Hundred’s fanbase, 31% of the audience falls in the 18-44 bracket, compared to just 24% for cricket as a whole.

Why does the audience matter for betting? Because a younger, more digitally engaged fanbase generates more in-play wagering activity. T20 live markets carry higher liquidity than their ODI and Test equivalents, which means tighter spreads on popular markets and more volatility on niche ones. The betting ecosystem around T20 is more active, more responsive, and more punishing of slow decision-making than any other cricket format.
T20 is also the format where individual player impact is most pronounced. A single batter can score 60% of a team’s total. A single bowler can concede or defend 30 runs in the death overs and single-handedly determine the outcome. This individual leverage means that player-level analysis — strike rates, matchup records, recent form by phase of innings — carries more predictive power in T20 than in any other format. I spend a greater share of my T20 research time on individual players than on team-level metrics, which is the opposite of my approach in Tests.
The format’s volatility is not random, though it can feel that way. It follows patterns — scoring accelerates in the powerplay, consolidates in the middle overs, and explodes in the death phase. Understanding those patterns and their market implications is the core of T20 betting strategy, and the sections that follow break each one down.
The Best Markets for T20 Wagering
I once had a conversation with a fellow bettor who told me he only ever backed the match-winner market in T20 because “that’s the bet.” He was leaving profit on the table every single matchday. T20’s compressed format generates a wider range of viable betting markets than Test or ODI cricket, and some of those markets carry significantly better margins than match-winner — if you know where to look.
Top batsman is my highest-volume T20 market. The logic is straightforward: in a format where one player can dominate the scorecard, predicting the top scorer is more about understanding batting positions and venue conditions than about modelling team-level probabilities. Openers and number-three batters face the most deliveries and have the longest runway to accumulate runs. On flat pitches with short boundaries, the top-order batter with the highest career strike rate in the powerplay is my default starting point. Bookmakers often price this market using broad career averages, which creates mispricing when a specialist powerplay hitter faces a weak new-ball attack on a pitch that suits aggressive strokeplay. I have found consistent value here across multiple T20 leagues.
Over/under innings runs is my second market of choice. T20 scoring is more predictable at venue level than most bettors realise. The average first-innings total at a given ground varies by 20-30 runs depending on the surface, boundary dimensions, and altitude. Once I have classified the venue, I set my own expected-total line before checking the bookmaker’s. Divergences of five or more runs signal a potential trade. The growing audience for T20 cricket — The Hundred’s Sky Sports viewership rose 38% in 2025 while its BBC Sport online audience climbed from 1.6 million to 2.2 million — drives deeper market coverage at bookmakers, which means more venues now carry dedicated over/under lines rather than generic ones.
Player performance multi-markets — combinations like “Player X to score 30+ runs and take 1+ wickets” — are the newest addition to the T20 betting menu and the least efficiently priced. These bets require the bookmaker to model correlations between batting and bowling performance for individual all-rounders, and my experience is that their correlation estimates are often crude. An all-rounder who bats at number five and bowls two overs in the powerplay has different performance correlations than one who opens the batting and bowls at the death. I exploit these distinctions by tracking all-rounder role data — when they bat, when they bowl, and how those roles shift by match situation.
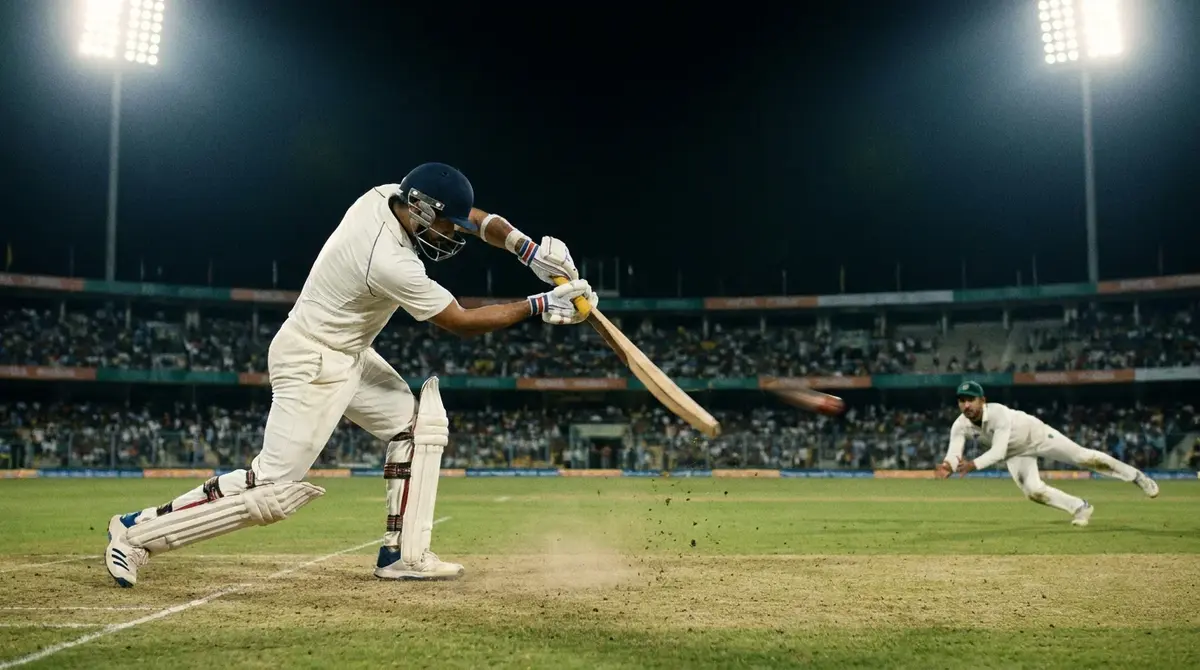
Boundary count markets — total fours, total sixes, or combined boundaries — are a niche I have grown to appreciate. Boundary production is closely tied to venue and pitch conditions, which makes it more predictable than it appears. A ground with 65-metre straight boundaries and a true pitch will produce more sixes than one with 75-metre boundaries and a slow surface. I cross-reference ground dimensions with the power profiles of the batting lineups to identify mismatches between the bookmaker’s line and the likely output.
One market I treat with extreme caution in T20 is the outright tournament winner. The variance in short-format cricket is simply too high for season-long positions to offer reliable value. I prefer to trade individual matches and build returns through volume rather than locking capital into a single futures position that depends on a two-month sequence of high-variance events all breaking the right way.
Player Metrics That Matter in T20 Betting
Batting average is the most quoted statistic in cricket and the least useful one for T20 betting. A batter who averages 42 in T20s sounds impressive until you discover that his strike rate is 115 — meaning he accumulates runs slowly, occupies deliveries that could go to more aggressive teammates, and his presence in the lineup actually suppresses the team’s total. In T20, strike rate is king. I prioritise it above average in every player assessment I make.
But raw strike rate across all innings is not granular enough. What I need is phase-specific strike rate: how a batter performs in the powerplay (overs 1-6), the middle overs (7-15), and the death (16-20). A batter who strikes at 160 in the death but 110 in the powerplay is a finisher, not an opener. If the bookmaker prices him as a top-batsman favourite based on his overall average, that is a mispricing I can exploit — because top-batsman probability is heavily weighted towards the powerplay, where his rate is pedestrian.
For bowlers, economy rate by phase is the equivalent metric. A bowler with a career T20 economy of 7.50 looks tidy, but if that number breaks down to 6.00 in the powerplay and 10.50 in the death, he is a powerplay specialist being deployed in the wrong phase — or the right phase, depending on the captain’s tactics. I track economy rate, bowling strike rate (deliveries per wicket), and dot-ball percentage by phase for every bowler in the leagues I bet on. Dot-ball percentage is an underused metric that captures a bowler’s ability to build pressure, which in T20 is often more valuable than taking wickets.
Matchup data adds another dimension. Certain bowlers have structural advantages against certain types of batters — left-arm spinners against right-handed batters who struggle with the ball turning away, pace bowlers with strong yorker control against power hitters who rely on length balls. I maintain a personal database of bowler-versus-batter records in T20 leagues, focused on the matchups that are most likely to occur in the powerplay and death phases. When a key matchup heavily favours one side, I weight that information into my probability estimate for the relevant player-props market.
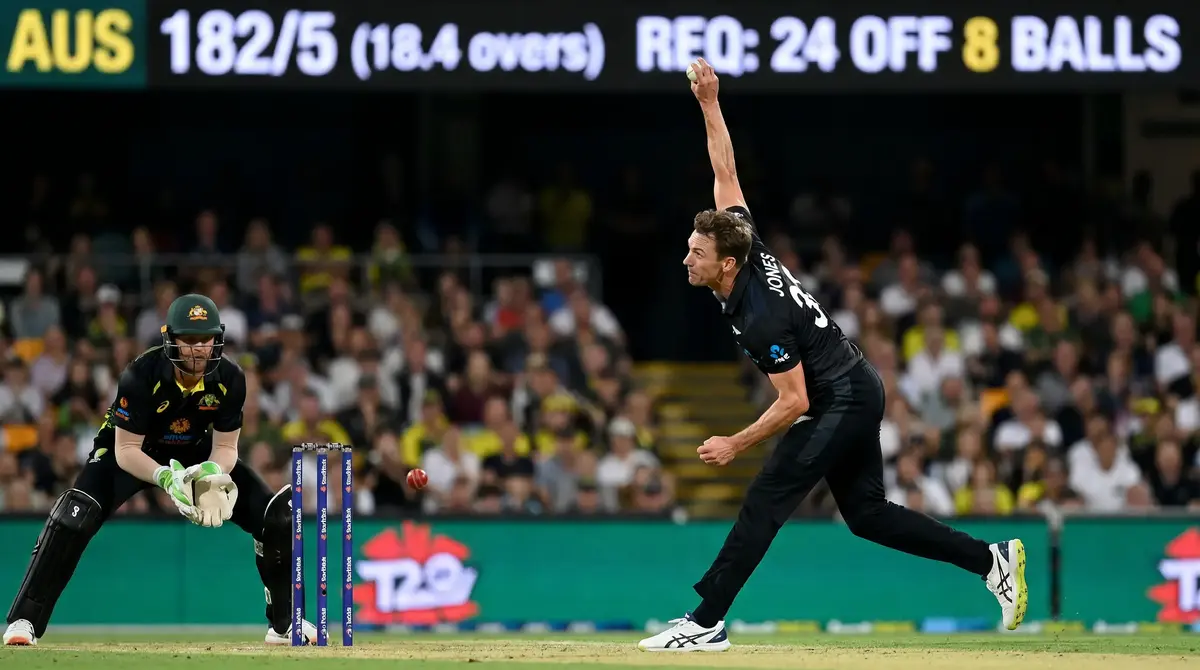
Recency matters more in T20 than in any other format. A batter’s form over the last ten innings is a better predictor of his next performance than his career average. The same applies to bowlers. T20 is a confidence format — when a batter is timing the ball well, he takes risks that pay off, and when he is not, the same risks produce cheap dismissals. I track rolling ten-innings averages and strike rates, updating after every match, and I weight recent data roughly three times more heavily than career data in my models. The batter with a career average of 35 but a last-ten-innings average of 18 is not the same player the career numbers suggest, and the bookmaker’s line, which often anchors to career data, is slow to reflect that.
How Conditions Shape T20 Outcomes
A flat pitch and a green pitch produce two entirely different T20 matches, and most bettors fail to adjust their expectations for either. I learned this the hard way during a Big Bash season when I treated every Australian ground as a batting paradise. Some are. Some decidedly are not. The Gabba in Brisbane produces bouncier, seam-friendly conditions that suppress run rates compared to the Adelaide Oval’s flat, true surface. The same logic applies worldwide — and it applies with even more force in T20 because there is no time for batting sides to absorb a difficult opening spell and recover over fifty or a hundred overs. If conditions favour bowling in the first six overs of a T20, the damage is permanent.
I classify T20-relevant pitch conditions along two axes: pace and turn. A fast, bouncy surface favours pace bowlers and power hitters who thrive on balls coming onto the bat. A slow, turning surface favours spinners and batters with strong wristwork who can manipulate rather than bludgeon. When I assess a T20 pitch, I ask two questions: will the new ball seam or swing in the powerplay, and will the surface grip for spinners in the middle overs? The answers determine which markets I target. A pitch offering new-ball movement makes the under on powerplay runs attractive. A pitch that grips for spin pushes me towards top-bowler bets on the turning side’s lead spinner.
Dew is the most underpriced condition variable in T20 betting. In day-night matches — the standard scheduling format across the IPL, Big Bash, and most franchise leagues — moisture settles on the outfield and the ball from roughly the 12th over of the second innings onward. Dew makes the ball skid through, reduces grip for spinners, and turns reliable death bowlers into boundary-conceding liabilities. The structural advantage I mentioned in the opening section — the chasing team’s higher win rate — becomes even more pronounced in dew-affected conditions. I check evening humidity forecasts for every day-night T20 I bet on and adjust my second-innings run expectation upward by eight to twelve runs when dew is probable.

Boundary dimensions deserve more attention than they receive. T20 grounds are not standardised — straight boundaries can range from 60 metres to 80 metres, and square boundaries from 55 to 75. A ground with short straight boundaries and a flat pitch amplifies six-hitting, which benefits power-dominant lineups. A ground with long straight boundaries and a slow surface rewards placement and running between the wickets, which favours technically proficient sides. I catalogue boundary dimensions for every ground in the leagues I bet on and cross-reference them with the power profiles of the teams scheduled to play. When a power-hitting lineup meets a short-boundary ground, the over on total sixes becomes one of my most reliable plays.
Comparing T20 Leagues by Scoring Patterns, Pitch Profiles, and Market Depth
Treating every T20 league as interchangeable is a mistake I watch bettors make season after season. The IPL, with its $18.5 billion brand valuation and 350-million-viewer average audience, operates in a different universe to the Bangladesh Premier League or the Lanka Premier League — not just commercially, but in terms of scoring patterns, pitch profiles, and the depth of betting markets available.
Scoring patterns vary dramatically across leagues. IPL first-innings totals regularly exceed 180, driven by flat pitches, short boundaries at several grounds, and the impact player rule that effectively gives teams an extra specialist batter. The Big Bash in Australia averages 10-15 runs lower per first innings, partly because of the larger grounds and partly because the playing standard is a tier below. England’s Hundred, with its rapidly growing fanbase and broadcast audience, produces scoring patterns that sit between the two — its 100-ball format compresses the innings further than T20 and alters the rhythm of acceleration. I maintain separate scoring baselines for each league I bet on and never transpose an expectation from one to another.
Pitch profiles cluster by geography. Indian pitches tend to start flat and deteriorate, which means first-innings scores are often the highest of the tournament early in the season and decline as the same surfaces are reused. Australian pitches offer more pace and bounce consistently, which favours fast bowling and front-foot batting. English pitches introduce swing and seam movement in early-season tournaments — The Hundred runs in July and August when conditions are drier, but the CPL (Caribbean Premier League) overlaps with the Caribbean wet season, producing slow, damp pitches that suppress run rates and boost spin bowling. Each geographic cluster requires its own conditions model.

Market depth — the number and variety of betting markets available for a given match — also differs sharply. A high-profile IPL fixture might carry 40 or more live markets, from next-ball outcome to specific bowler figures. A Bangladesh Premier League match might carry eight. Market depth matters because wider menus give you more places to find value, but thinner menus carry wider margins on each individual market. I prioritise leagues where the market depth allows me to operate across multiple market types simultaneously: IPL, Big Bash, The Hundred, and international T20s. Smaller leagues are viable but demand sharper pre-match analysis to compensate for the narrower in-play options.
One practical rule I follow: I never bet on a T20 league until I have watched at least five matches from the current season. That threshold gives me enough data to calibrate my scoring baselines, identify the standout performers of the tournament rather than relying on pre-season reputation, and spot any venue or conditions patterns that differ from historical norms. Patience at the start of a season saves money throughout the rest of it.
Death Overs and Endgame Betting in T20
The death overs — typically overs 16 through 20 — are where T20 matches are decided and where the most extreme live-betting swings occur. I have seen match-winner odds shift by over 100% in the space of three overs as a death-bowling specialist dismantled a batting lineup, and I have watched them swing just as violently in the other direction when a power hitter launched four sixes in an over to steal an improbable chase. This phase is not for the faint-hearted, and it is not for bettors who lack a specific plan for how to engage with it.
My approach to death-overs betting rests on two inputs: the bowling team’s death-over economy rate over their last ten matches, and the batting team’s scoring rate in the same phase. The gap between those two numbers — what I call the death differential — is the strongest single predictor I have found for second-innings outcomes in the final five overs. When a strong death-bowling unit faces a batting side that accelerates modestly, the under on last-five-overs runs is consistently profitable. When a weak death-bowling unit faces explosive finishers, the over on last-five-overs runs pays reliably. I do not try to predict which way the final over will swing. I position myself based on the structural matchup and let the probabilities play out over many bets.
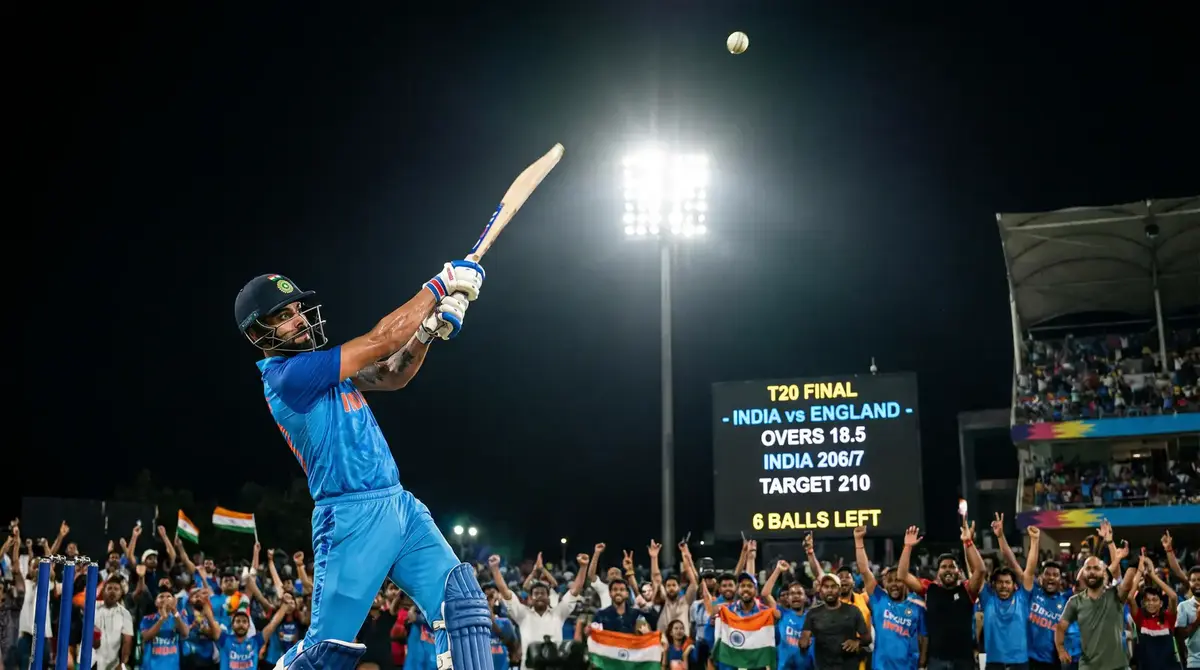
One tactical adjustment I make during the death phase is widening my staking criteria. In the powerplay and middle overs, I require a five-percentage-point gap between my probability estimate and the implied odds before acting. In the death overs, I loosen that threshold to three percentage points, because the speed of price movement means waiting for a larger gap often means missing the trade entirely. The trade-off is a slightly lower edge per bet offset by a higher frequency of actionable opportunities.
The death phase also produces the highest concentration of micro-betting opportunities — next-ball markets, next-over totals, and method-of-next-wicket — which attract recreational punters in large numbers and create inefficiencies that sharper bettors can exploit. If death overs betting in cricket is where you want to specialise, I have written a dedicated guide that covers the matchup analysis, the specific markets, and the risk management techniques in detail. For the purposes of this T20 overview, the essential point is this: the death phase rewards preparation and punishes impulse. Know the matchup before the 16th over begins, or stay out entirely.
T20 Cricket Betting — Common Questions
Recommend
Published by the cricketbettipsonline.com team.
