

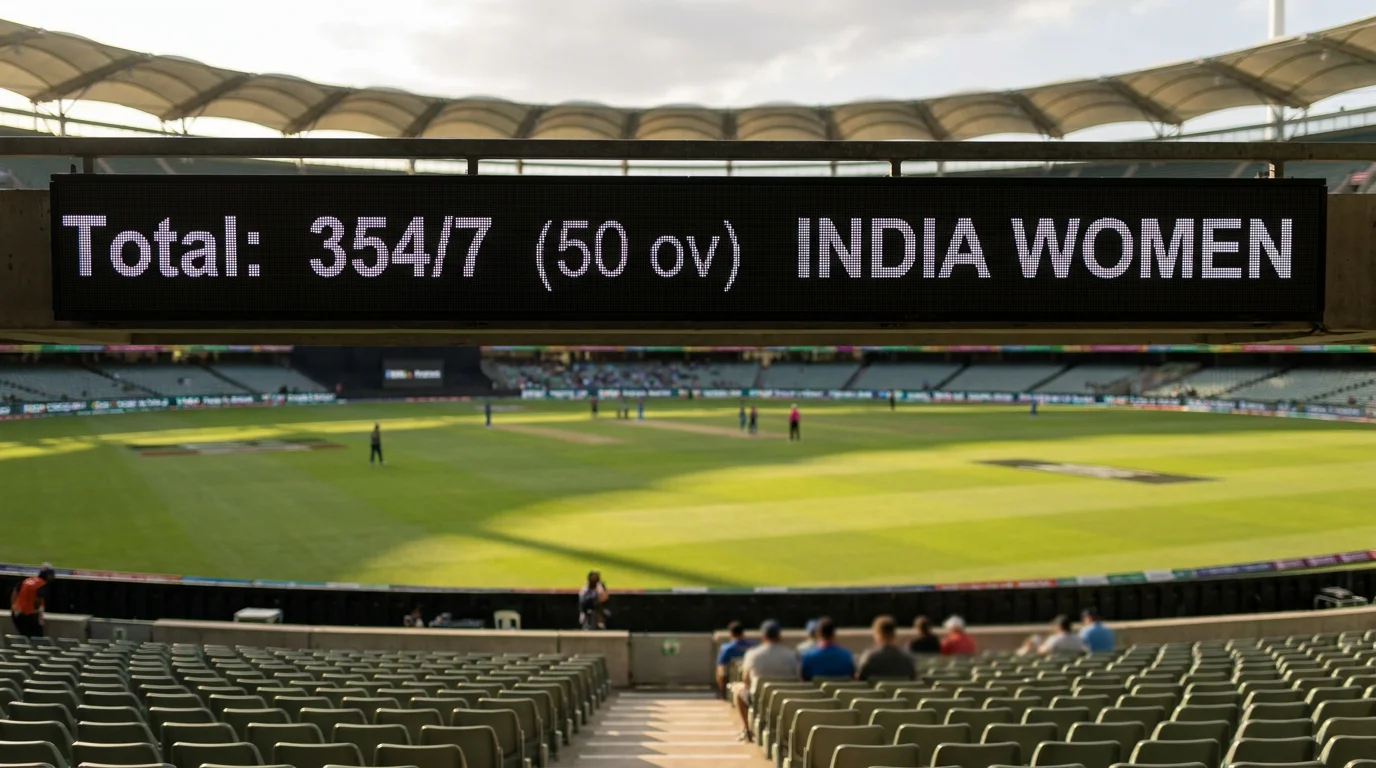
Cricket Over Under Betting Strips Complexity Down to One Number
I placed my first over/under bet on a Headingley Test in 2017, and the simplicity of it almost felt like cheating. No need to predict who wins. No guessing the top scorer. Just one question — will the combined total land above or below a number the bookmaker sets? That single decision cuts through the noise that bogs down most cricket betting markets, and nine years later it remains one of my go-to approaches.
The global cricket betting market hit $14.45 billion in 2024 and is on course for $36.24 billion by 2033, growing at a compound annual rate of 10.78%. A meaningful share of that growth sits in total runs and total wickets lines, because over/under appeals equally to casual punters and seasoned analysts. You do not need an encyclopaedic knowledge of every squad member to form a view on run totals — you need to understand conditions, scoring trends, and the format being played.
Michael Dugher, then CEO of the Betting and Gaming Council, once described the industry as “a hugely significant contributor to the leisure industry, to sport and to the UK economy as a whole.” Over/under markets sit right at the heart of that contribution — accessible, high-volume, and genuinely skill-sensitive when you approach them with data rather than instinct. This guide breaks down how those lines are built, how they shift across formats, and where the edges hide.
How Over/Under Lines Are Set in Cricket
A few years ago I sat next to a former odds compiler at a county match, and his explanation of line-setting stuck with me. “We start with venue averages,” he said, “then adjust for who is playing, what the weather looks like, and which way the pitch has been trending.” That process has not changed much, even with algorithmic pricing taking over most of the heavy lifting.
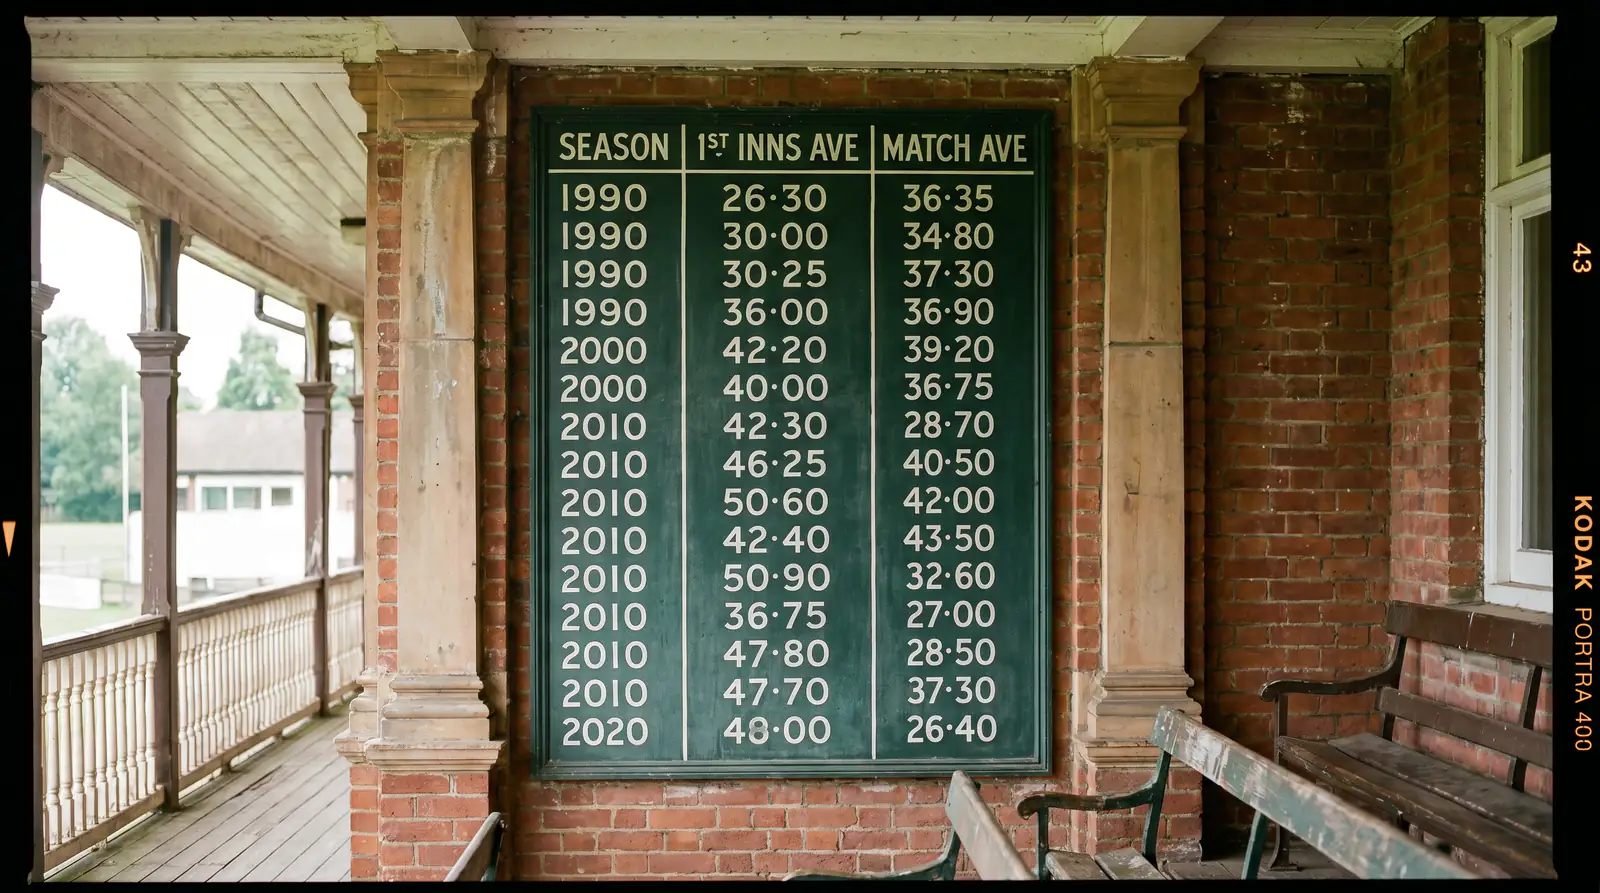
Bookmakers compile historical data for a specific ground — average first-innings scores, second-innings run rates, and the distribution of totals across recent seasons. If a ground has averaged 320 combined runs per day in Championship matches over the past three years, that number anchors the opening line. From there, adjustments layer on. A fresh green pitch shaves runs off the total. A flat subcontinental road adds them. Squad composition matters too: a top-heavy batting lineup facing a depleted bowling attack nudges the line upwards, and vice versa.
The line you see published is not the compiler’s best guess at the actual total. It is the number designed to attract roughly equal money on both sides. That distinction matters enormously. When the line differs from your own assessment of the likely total, you have found the space where profit lives. If you estimate 175 combined runs in a T20 and the line sits at 165.5, the over looks attractive — provided your reasoning accounts for the same variables the compiler used, plus anything they might have underweighted.
Wicket totals follow the same logic but respond to different inputs. A seaming pitch with overhead cloud cover pushes expected wickets up. A belting flat track where bowlers cannot find purchase pulls wicket lines down. Understanding how a bookmaker constructs the number is the first step toward disagreeing with it productively.
Over/Under Dynamics Across T20, ODI, and Test
I learned this lesson the hard way during the 2019 IPL. A total runs line that looked generous for an ODI was actually tight by T20 standards, and I lost money because I had not adjusted my mental model to the format. Each version of cricket produces totals in a different range, with different volatility, and your over/under approach needs to reflect that.
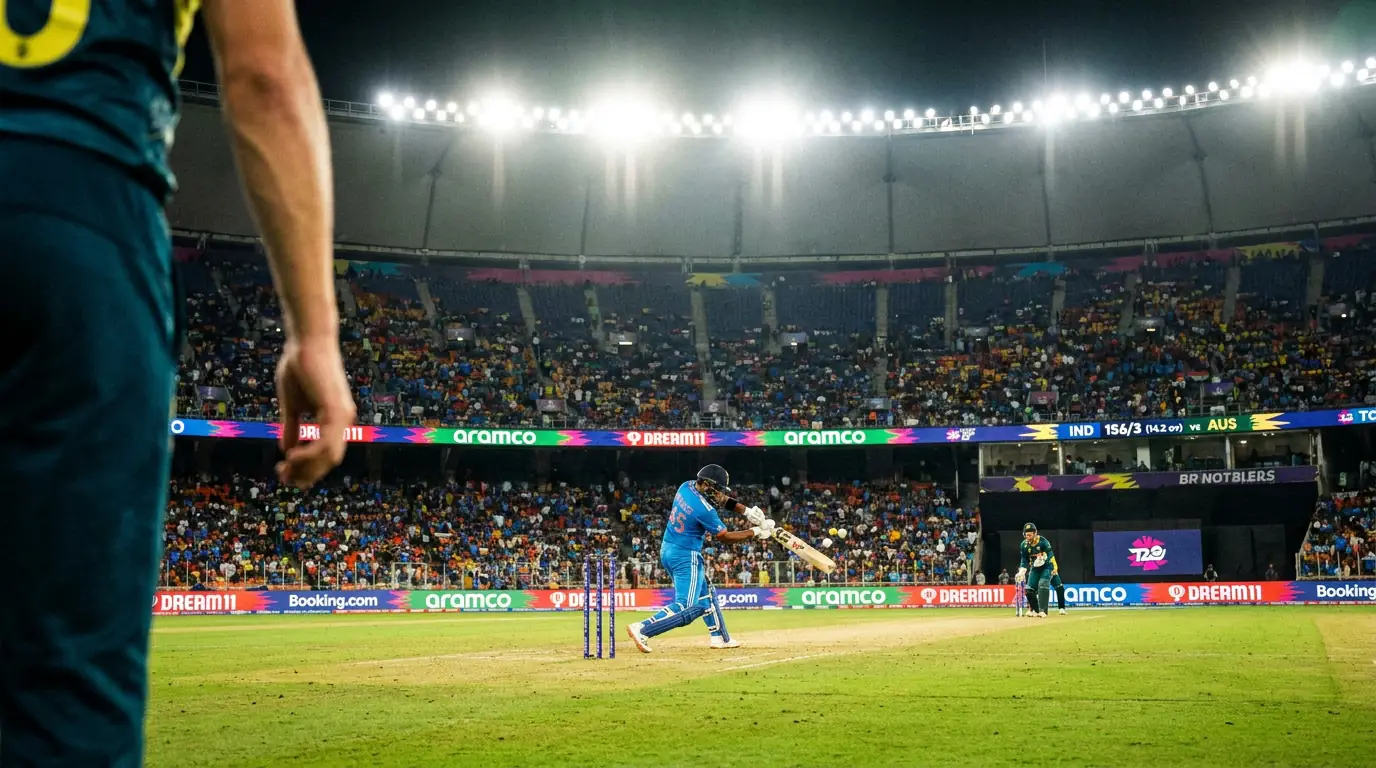
T20 matches generate the most compact range of totals, usually somewhere between 280 and 400 combined runs depending on the venue and league. The in-play betting segment for cricket is growing at a compound annual rate of 11.9% and dominates the market — T20 over/under is a big reason why. When the powerplay explodes for 60 runs, live totals adjust in real time, and punters who understand T20 scoring rhythms can find mispriced lines mid-innings.
ODIs stretch the range wider. A match between two strong batting sides on a flat surface might see combined totals push past 600. But when conditions help bowlers or a side collapses early, 400 combined is realistic. The three-phase structure of an ODI — aggressive powerplay, cautious middle overs, frantic death overs — means you are essentially pricing three separate mini-games stacked together. I find that over/under lines in ODIs are most exploitable when the middle-overs compression gets underestimated. On slow surfaces, teams routinely score 30 to 40 fewer runs in overs 11 through 35 than historical averages would suggest, dragging the total under.
Test cricket is an entirely different animal. Totals are set per innings, per session, or per day rather than per match. A session-runs line of 85.5 on a day-five worn pitch is a very different proposition to the same line on a day-one flat track. Test over/under rewards patience and a detailed understanding of how surfaces deteriorate — something the other two formats never require you to factor in.
Factors That Push Totals Up or Down
Every over/under decision I make starts with a mental checklist, and the first item is always the pitch. A green-tinged surface at Trent Bridge behaves nothing like a dry, cracked deck in Chennai, and the run-scoring implications are enormous. Grass coverage helps seam bowlers extract lateral movement, which shortens innings and pulls totals down. Dry, abrasive surfaces offer turn for spinners from day two onwards in Tests but can be batting paradises on day one — so the same ground can justify both overs and unders depending on when you are betting.

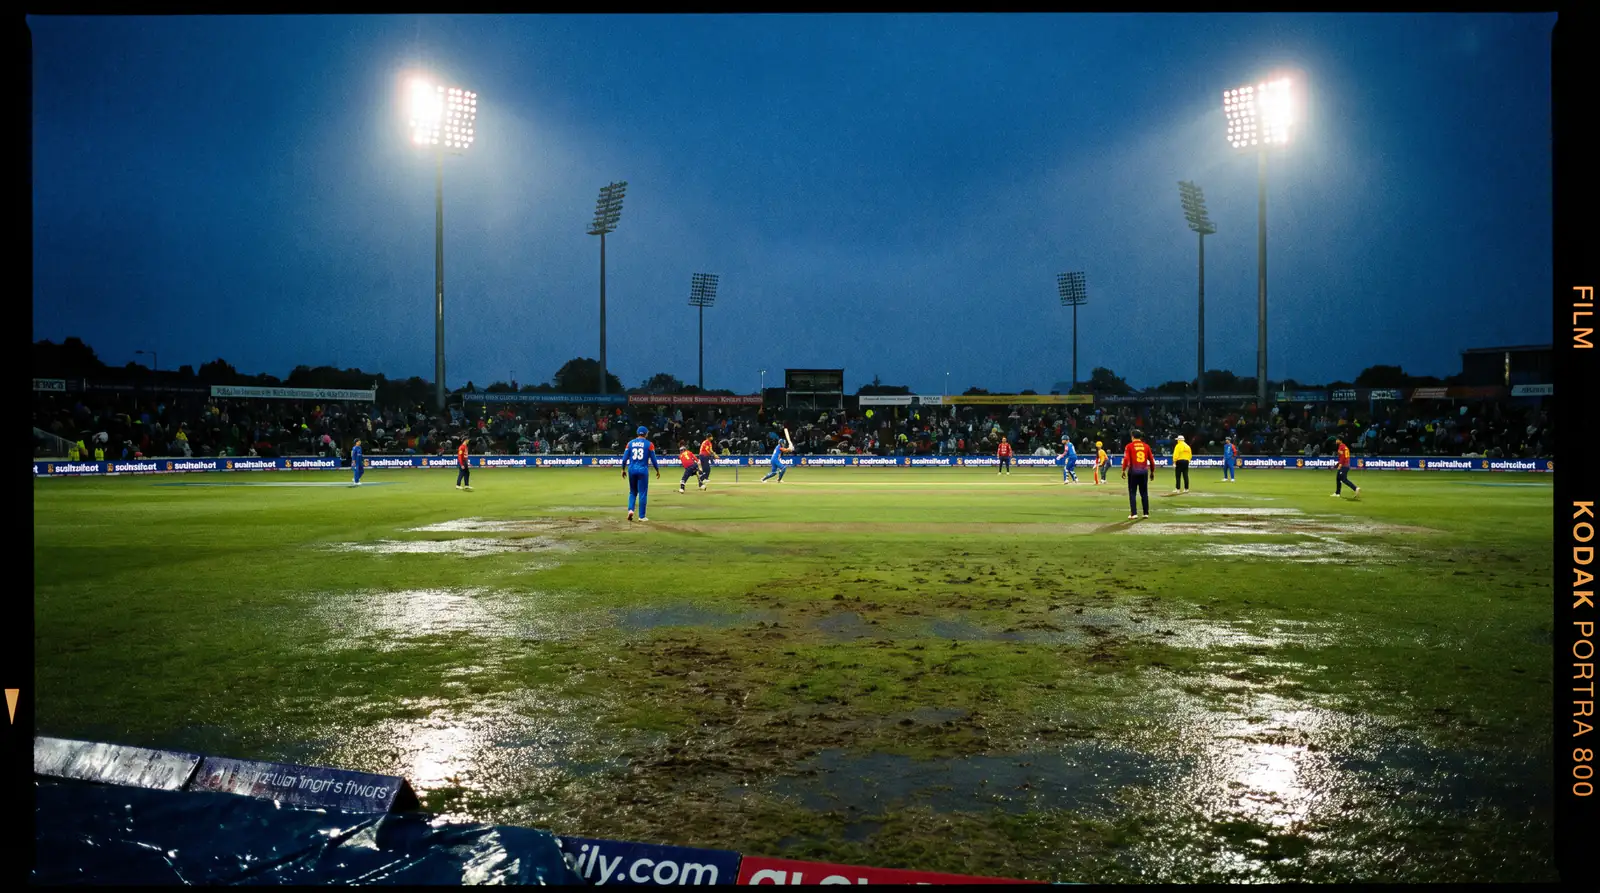
Weather layers on top. Overcast skies in England assist swing bowling, compressing totals. Dew in subcontinental evening matches makes the ball skid on faster in the second innings, often inflating second-innings scores and pushing combined totals over. The data bears this out: in T20 cricket, teams batting second win approximately 53 to 55 percent of matches, partly because dew and chasing psychology favour second-innings run accumulation. If a day-night T20 looks likely to feature heavy dew, the over on total runs gains a tangible statistical tailwind.
Team form is the third lever, and the one most punters over-index on. A side might have scored 200-plus in three consecutive T20 innings, but if the next match is at a venue where the average first-innings total is 155, recent form is less predictive than the ground profile. I weight venue data more heavily than team form in over/under markets — roughly a 60/40 split in my modelling. Injuries to key bowlers inflate totals, while the loss of an explosive opener can pull them down. Combining these factors into a single estimate, comparing it to the published line, and betting only when you see clear daylight between the two is the repeatable process that turns over/under from a coin flip into a consistent edge.

Articles
Written by the editors at cricketbettipsonline.com.
